Numbers: no reason for major parties to celebrate
WHILE the Nationals justifiably celebrate winning the by-electorate, they are a long way from the 54 percent majority they enjoyed 10 years ago with George Souris, down to only 30 percent, with 70 percent of the electorate casting their primary vote to other candidates.
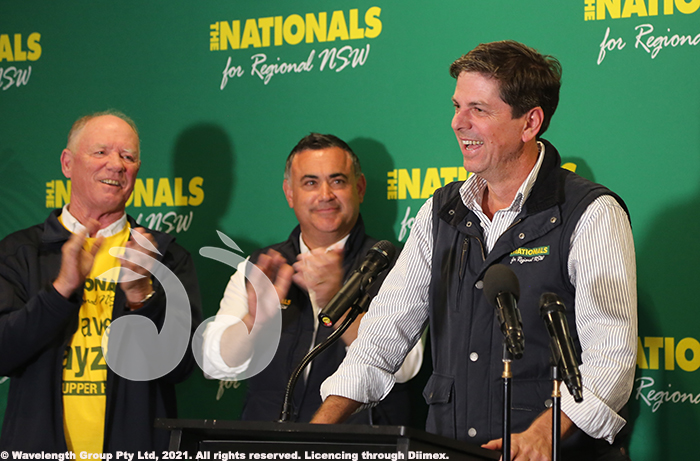
NSW Nationals Chairman Andrew Fraser, Deputy Premier John Barilaro and new Member for Upper Hunter David Layzell.
The commentary around the election has called on Labor to do some soul searching, which over the same 10 year period has only increased marginally from 17.9 percent to 20 percent.
Arguably both major parties need to ponder why 44.88 percent of the electorate opted to give their first preference to an independent or smaller party, up from only 27.5 percent a decade ago.
See primary preferences over 10 years below.
The main variable in this election was the choice of 11 other candidates, representing independents and smaller parties.
So many candidates deciding to run, demonstrates the growing dissatisfaction with the major parties and while it may have split the vote, more than 40 percent of voters gave their first preference to these candidates over the majors.
The increasing risk to the major parties in this seat, is a strong independent or alternate party candidate consolidating that support.
In 2011, Tim Duddy ran as an independent and enjoyed 19.3 percent of the vote, ahead of Labor’s 17.9 percent and in 2019 Lee Watts ran for the Shooters, Fishers and Farmers and gained 22 percent of the primary vote.

Independent Kirsty O’Connell casting her vote – Aberdeen Primary School has never seen so much media.
The other consideration for the major parties is if the voters cotton on to the power of their preferences. While the primary vote may be dispersed, if voters do begin to cast preferences and the independents and smaller parties coordinate a voting strategy, those first preferences may flow to a dominant independent or smaller party.
The wisest major party will work out how to harness those preferences to their advantage, but wiser still would be to address the fundamental issue of why the majority of voters in the electorate did give a major party their first preference.
See how the primary votes have changed in just 10 years:
2011:
- Nationals – George Souris: 54.7%
- Independent – Tim Duddy: 19.3%
- Labor – Michael Gibbons: 17.9%
- The Greens – Chris Parker: 5.7%
- Christian Democrats – Fred Crowley: 2.5%
2015:
- Nationals – Michael Johnsen: 38.9%
- Labor – Martin Rush: 32.5%
- Independent – Lee Watts: 19.4%
- The Greens – John Kaye: 5.5%
- Christian Democrats – Richard Stretton: 2.1%
- No Land Tax – Louisa Checchin: 1.6%
2019
- Nationals – Michael Johnsen: 33.99%
- Labor – Melanie: 28.65%
- Shooters Fishers Farmers – Lee Watts: 22.04%
- The Greens – Tony Lonergan: 4.78%
- Liberal Democrats – Mark Ellis: 4.43%
- Sustainable Australia – Calum Blair: 2.2%
- Animal Justice – Claire Robertson: 1.98%
- Christian Democrats – Richard Stretton: 1.91%
2021
- Nationals – David Layzell: 30.42%
- Labor – Jeff Drayton: 20.76%
- One Nation – Dale McNamara: 12%
- Shooters, Fishers and Farmers – Sue Gilroy: 11.65%
- Independent – Kirsty O’Connell: 8.6%
- Independent – Tracy Norman: 4%
- The Greens – Sue Abbott: 3.33%
- Independent – Steve Reynolds: 2.13%
- Independent – Kate Fraser: 1.3%
- Liberal Democrats – Eva Pears: 1.39
- Animal Justice – Michael Dello-Iacovo: 0.8%
- Sustainable Australia – Claim Blair: 0.75%
- Independent – Archie Lea: 0.32
Tags: Upper Hunter by-election, Voting